Building a Real-time Game of Thrones Voting App with GraphQL and Chart.js

TL;DR 🕑
I've always wanted to do a voting app.. do so I just built one 🤷🏾♂️
— 𝙳𝚊𝚗𝚒𝚎𝚕 𝙼𝚊𝚍𝚊𝚕𝚒𝚝𝚜𝚘 𝙿𝚑𝚒𝚛𝚒 (@malgamves) April 26, 2019
How I built the project:
📊 @vuejs + @chartjs on the frontend 🖥️
😈 @HasuraHQ + @apollographql in the backend ⚡
🚀 Deployment @Netlify 🔥
So that's realtime updates on the chart thanks to subscriptions ⚡⚡ pic.twitter.com/RPbq1TtUt9
The Long Version 😉
I've always wanted to do a voting app because hey - they're cool! I read an article on how to build charts in JavaScript with chart.js and GraphQL using an amazing tool called graphql2chartjs. The timing was amazing, Game of Thrones' battle of Winterfell was a few days away so I decided to get a taste of who folks thought would stray into the long night on the episode.
I tweeted this out and waited ⏳
👋Hey #GameofThrones fans!
— 𝙳𝚊𝚗𝚒𝚎𝚕 𝙼𝚊𝚍𝚊𝚕𝚒𝚝𝚜𝚘 𝙿𝚑𝚒𝚛𝚒 (@malgamves) April 26, 2019
The Battle for Winterfell is this Sunday and it's going to be HUGE!
I built a Web App to crowd source some votes and see whose watch ends this Sunday.
We've got like what.. 2 days to vote? Check it out 👇👇https://t.co/RPW8WCg1jI
Do it #ForTheThrone
The app got a very shocking 10,000 votes before the episode aired

Not to mention, over 50% of the votes were for Grey Worm #RIPGreyWorm

Scary stuff! I reset the votes tally so you can get a feel of the app and its functionality.
🚀 Give it a go! 📈📈
⚙️ How I built it ⚙️
The App has: 📊 Vue.js + Chartjs on the frontend 🖥️ 😈 Hasura + Apollo GraphQL in the backend ⚡ 🚀 Deployed on Netlify 🔥
🔧 Backend 🔧
I used Hasura and it's one-click Heroku Deployment to set up my backend. Hasura gives us real-time GraphQL over a PostgreSQL database. Next up we need to define a schema, in the Data section of the API Console, we have to create a characters table with the following columns...
-id holds an integer value, is the primary key and is auto incremented
-name holds a text value
-votes hold an integer value and have the default value set to 0
Once you have the schema setup, you have to enter the character names manually in the Data section of the API Console.
We're done with the backend for now.
✨ Frontend ✨
Like I said above, I did the frontend in Vue.js, we’d have to install it before we can go on and to do that we’ll need Node.js on our system. Once we’ve got node installed, enter the following command to install the vue cli npm i -g @vue/cli. To set up a new Vue project, we enter the following command vue create myapp, replace myapp with whatever funky name you want to call this app and click default when prompted to pick a preset. When done initializing, your folder structure should resemble the one below.
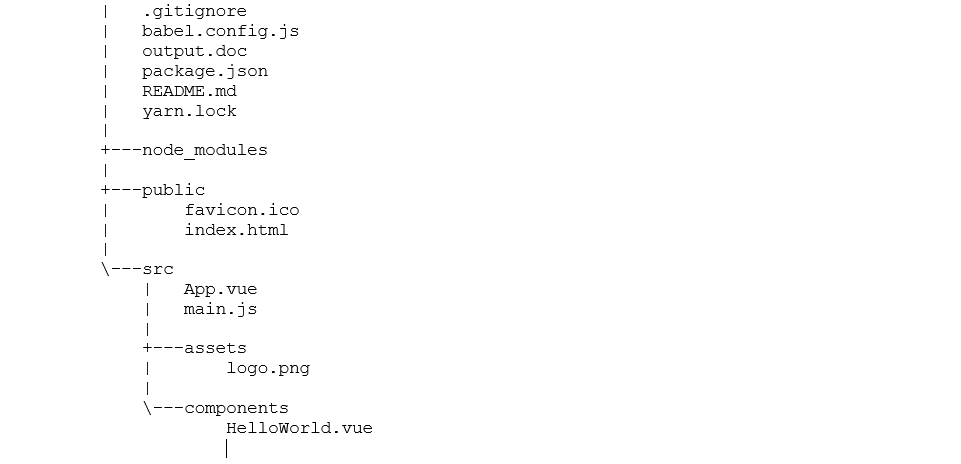
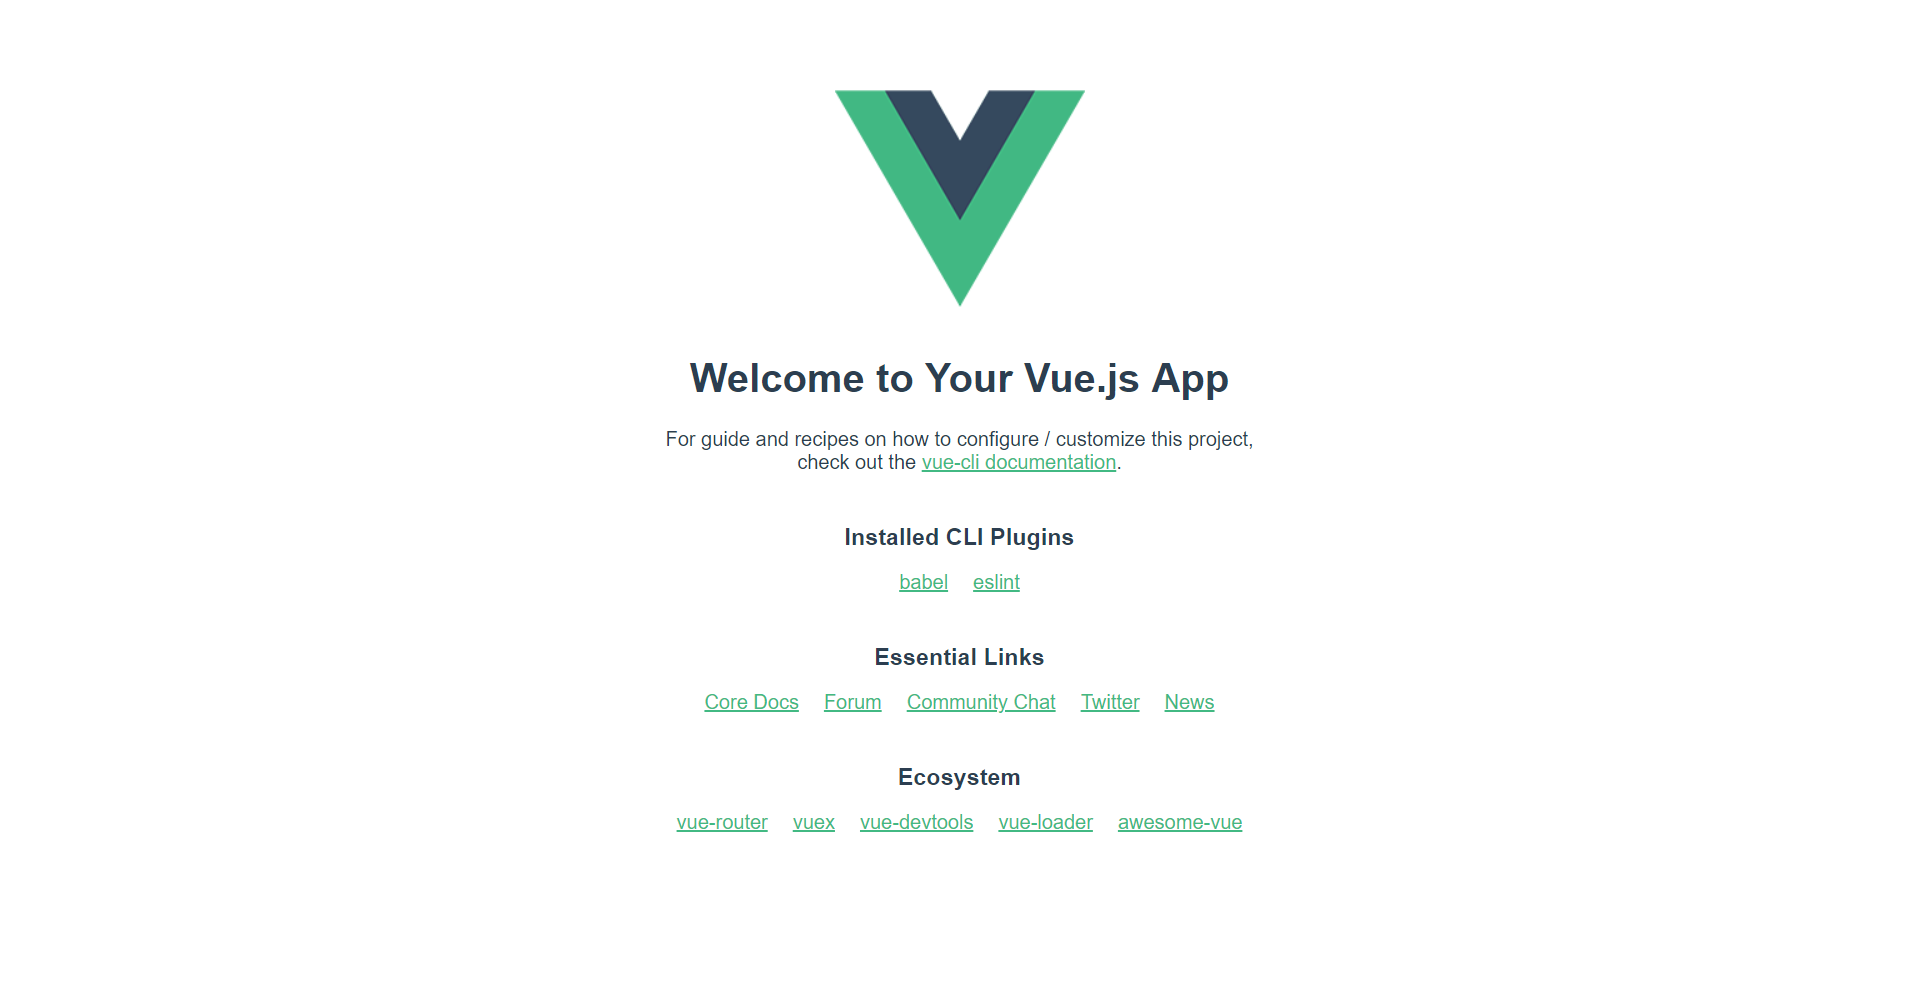
When the app is done initializing, cd <myapp> and enter npm run serve to run your app. The command line will display a local address that your app is being hosted on, open your browser and go to that address. This should be what you see.
Putting it Together 🤝
At this point, we have a basic Vue App on the frontend and our backend with Hasura is initialized. The goal is to create an app to visualize the death votes for Game of Thrones characters, so we go on and install our visualization tool, chart.js with the following commands npm install vue-chartjs chart.js --save. We also install graphql2chartjs the tool that helps us read graphql data and use that in our charts, to do that we run the command npm install --save graphql2chartjs.
We've got to import a few files into our main.js file. After which, your main.js should look like this:
import { ApolloClient } from 'apollo-client'
import { WebSocketLink } from 'apollo-link-ws';
import { HttpLink } from 'apollo-link-http';
import { split } from 'apollo-link';
import { getMainDefinition } from 'apollo-utilities';
import { InMemoryCache } from 'apollo-cache-inmemory';
import Vue from 'vue'
import VueApollo from 'vue-apollo'

import App from './App'

Vue.config.productionTip = false

const httpLink = new HttpLink({
  // You should use an absolute URL here
  uri: 'https://<your-app-name>/v1alpha1/graphql'
});

const wsLink = new WebSocketLink({
  uri: "wss://<your-app-name>.herokuapp.com/v1alpha1/graphql",
  options: {
    reconnect: true
  }
});

const link = split(
  // split based on operation type
  ({ query }) => {
    const { kind, operation } = getMainDefinition(query);
    return kind === 'OperationDefinition' && operation === 'subscription';
  },
  wsLink,
  httpLink,
);


const apolloClient = new ApolloClient({
  link,
  cache: new InMemoryCache(),
  connectToDevTools: true
})


Vue.use(VueApollo)


const apolloProvider = new VueApollo({
  defaultClient: apolloClient,
  defaultOptions: {
    $loadingKey: 'loading'
  }
})

/* eslint-disable no-new */
new Vue({
  el: '#app',
  apolloProvider,
  render: h => h(App)
})
A lot of the packages imported are explained in two articles I did on queries and mutations in GraphQL below...
Seeing as the chart will be displaying data in real-time, we will be using subscriptions which we will cover now. As usual, there are a few things we have to look out for, on lines 16 and 20 you need to paste the name of your app so that Apollo can help your Vue app communicate with the GraphQL backend.
Pay attention to line 19, our implementation of subscriptions uses a web socket to keep a constant connection to the server and serve fresh and updated data to the UI.
After tinkering around with the main.js file, in the src, we have to create a folder called constants where we create a file called graphql.js. In that file, we need to import gql by pasting import gql from graphql-tag; at the top of the file.
The graphql.js file lets us have a common file to keep all our queries, mutations and subscriptions. This makes it easy to export them into the App.vue when we need to.
Your graphql.js file should look something like this...
import gql from 'graphql-tag'

export const ADD_VOTE_MUTATION = gql`
  mutation updateVotes($id: Int!) {
    update_characters(where: {id: {_eq: $id}},
      _inc: {votes: 1}) {
        affected_rows
    }
  }
`;

export const ALL_CHAR_QUERY = gql`
  query characters {
    characters(order_by: {id: asc}) {
      id
      name
  }
  }
`;

export const ALL_VOTES_SUBSCRIPTION = gql`
  subscription allVotes{
      CharacterDeathVotes : characters(order_by: {id: asc}) {
      label: name
      data: votes
    }
  }

`;
The ALL_VOTES_QUERY query gets the name and id of an entry in the characters table. Similarly, you can try out other operations and add them to the file as I have. Similarly,
We then create the chart component that we will later export into our App.vue file. We call this BarChart.js. This is the standard format if one wants a reactive chart that gets data from an API which in our case is our GraphQL API. The vue-chart.js docs cover this in detail.
import { HorizontalBar, mixins } from 'vue-chartjs'
const { reactiveProp } = mixins


export default {
  extends: HorizontalBar,
  mixins: [reactiveProp],
  props: {
    chartData: {
      type: Object,
      default: null
    },
    options: {
      type: Object,
      default: null
    }
  },
  mounted () {
    this.renderChart(this.chartData, this.options)
  }
}
Now, in your App.vue file, the changes you make will be displayed when
<template>
  <div id="app">
    <div class="container">
      <div class="row">
            <div class="column">
              <h2>Who Might Die ⚔️</h2>
            </div>
            <div class="column">
              <h2
                v-if="loading"
              >⚖️ Total Votes: {{totalVotes.characters_aggregate.aggregate.sum.votes}}</h2>
            </div>
          </div>
      <div class="button-box">
        <div v-for="charName of characters" v-bind:key="charName.id">
          <button class="button" @click="updateVotes(charName.id)">{{charName.name}}</button>
        </div>
      </div>
      <div>
        <div class="chart">

          <bar-chart v-if="loaded" :chartData="chartData" :options="options" :width="200" :height="300"/>
        </div>
      </div>
    </div>
  </div>
</template>

<script>
import BarChart from "./components/BarChart.js";
import {
  ALL_CHAR_QUERY,
  ADD_VOTE_MUTATION,
  ALL_VOTES_SUBSCRIPTION,
  SUM_VOTES_SUBSCRIPTION
} from "./constants/graphql";
import graphql2chartjs from "graphql2chartjs";
export default {
  name: "app",
  props: {
    msg: String
  },
  data() {
    return {
      loaded: false,
      loading: false,
      characters: "",
      totalVotes: 0,
      chartData: null,
      options: {
          scales: {
            yAxes: [{
              ticks: {
                beginAtZero: true
              },
              gridLines: {
                display: false
              }
            }],
            xAxes: [ {
              gridLines: {
                display: true
              }
            }]
          },
          legend: {
            display: true
          },
          responsive: true,
          maintainAspectRatio: true
        }
    };
  },
  components: {
    BarChart
  },
  methods: {
    updateVotes(id) {
      this.$apollo.mutate({
        mutation: ADD_VOTE_MUTATION,
        variables: {
          id: id
        }
      });
    }
  },
  apollo: {
    characters: {
      query: ALL_CHAR_QUERY
    },
    $subscribe: {
      votes: {
        query: ALL_VOTES_SUBSCRIPTION,
        result({ data }) {
          const g2c = new graphql2chartjs();
          g2c.add(data, "bar");
          this.chartData = g2c.data;
          this.loaded = true;
          //console.log(g2c.data)
        }
      },
      sumVotes: {
        query: SUM_VOTES_SUBSCRIPTION,
        result({ data }) {
          if (data) {
            this.totalVotes = data;
            this.loading = true;
            //console.log(data);
          }
        }
      }
    }
  }
};
</script>

<style>
#app {
  font-family: "Avenir", Helvetica, Arial, sans-serif;
  -webkit-font-smoothing: antialiased;
  -moz-osx-font-smoothing: grayscale;
  color: #2c3e50;
  margin-top: 1%;
}
.container {
  margin: 0 auto;
}
.row {
  display: flex;
}
.column {
  flex: 50%;
  text-align: center;
}
.chart {
  box-shadow: 0px 0px 20px 2px rgba(0, 0, 0, 0.4);
  border-radius: 10px;
  padding-top: 15%;
}
button {
  background-color:black;
  border-radius: 10px;
  color: white ;
  width: 100px;
  height: 40px;
  float: left;
  margin: 2%;
  text-align: center;
}
.button-box {
  text-align: center;
}
</style>
In the App.vue there are three snippets that you need to pay attention to:
Number 1️⃣
<div v-for="charName of characters" v-bind:key="charName.id">
     <button class="button" @click="updateVotes(charName.id)">
        {{charName.name}}
     </button>
</div>
The variable characters stores the result of the ALL_CHAR_QUERY query. We use the v-for directive to print out each item in the result array as the title of a button. It is important that we use the v-bind directive to bind the character ID and use it as a key to iterate over the items in the results array i.e all the characters in our database. This will prove useful when binding each vote to a specific character.
Number 2️⃣
<h2 v-if="loading">
⚖️ Total Votes: {{totalVotes.characters_aggregate.aggregate.sum.votes}}
</h2>
I wanted to be able to show the total number of votes places. This snippet does just that. The number updates as users vote in realtime, which mean we would have to subscribe to that data. To achieve this... I left the subscription to do this out of the graphql.js code I shared. Don't worry though, the Hasura Graphiql has a very intuitive way of creating subscriptions (shown below) by ticking boxes and it will write out the text for you.

Once you do that, copy the subscription generated and paste it in the graphql.js file to enable it.
We use v-if to display the data only if the data is done loading otherwise you can get an undefined object at times and we wouldn't want that, would we?
Number 3️⃣
<div class="chart">
      <bar-chart v-if="loaded" :chartData="chartData" :options="options" :width="200" :height="300"/>
</div>
Here, we import the bar-chart component we created with BarChart.js and pass the data using the chartData and options variables. Again you see us using the v-for directive to render the chart only after the data has loaded, we do this to avoid errors.
After these additions, you can style the application and npm run serve to see some pretty cool bar charts. That's pretty much how the web app came to be. It's worth mentioning that when building it in, I gave some thought to adding and omitting certain functionality. There are a few things I left out, namely:
- I didn't restrict voting to a single vote per user
- I didn't give users the ability to start their own poll
The project is up on GitHub, feel free to fork and add any functionality you need or would want!
Drop me a question on Twitter if you have any. Hope you enjoyed reading this. Till next time :)